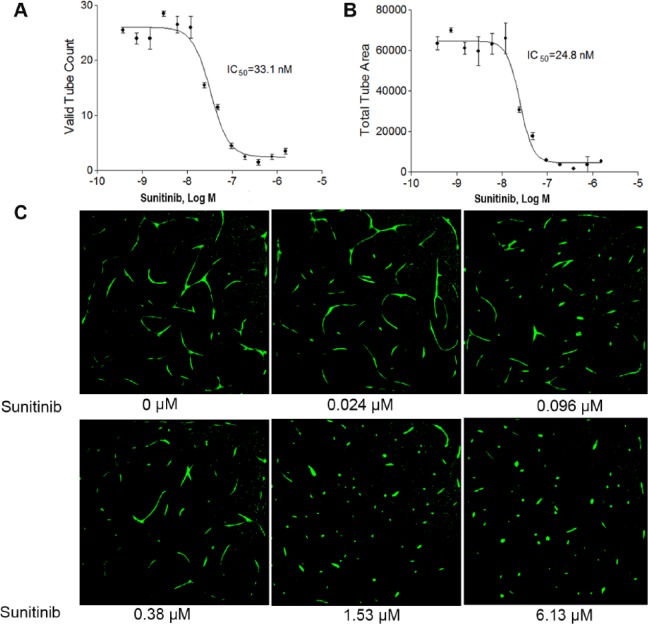
Figure 2.
Effect of sunitinib on angiogenesis inhibition in 1536-well plates. Concentration–response curves of sunitinib after a 48 h treatment using (A) valid tube count and (B) total tube area. Each value represents the mean ± SD of three independent experiments. (C) Representative images of GFP-labeled angiogenesis tube formation in the absence or presence of sunitinib. The images were acquired using an ArrayScan VTI reader with a 5× objective. Excitation: 488 nm; emission: 530 nm.

