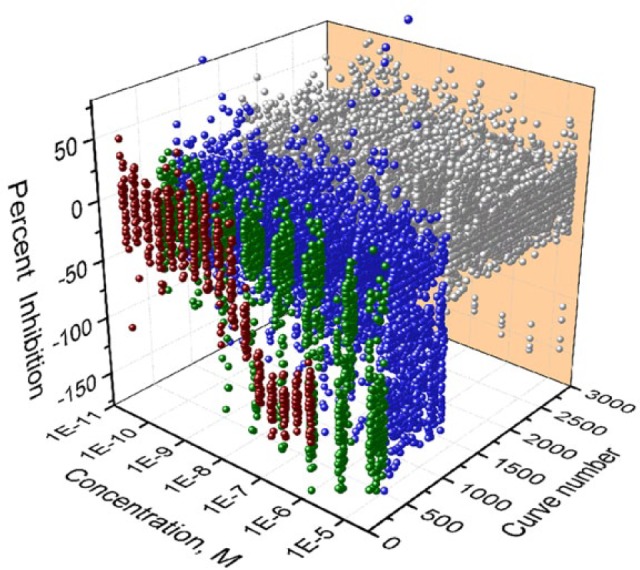
Figure 3.

qHTS concentration–response data binned into curve classes. Concentration–response curves for 2816 substances tested, including all the replicates. Concentration–response curves of the positive control, sunitinib (dark red color); compounds with curve classes −1.1, −1.2, and −2.1 (green color); and compounds with curve classes −1.3, −1.4, −2.2, −2.3, −2.4, and −3 (blue color). The inactive compounds are classed as curve class 4, shown in gray.
