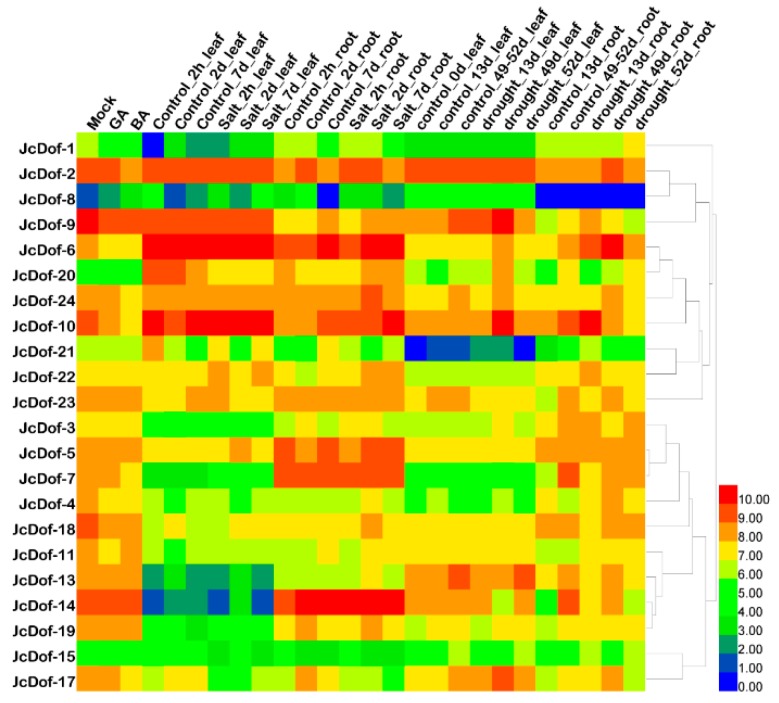
Figure 6.
Expression patterns of JcDof genes under different treatments. The heatmap was generated by HemI software using the expression data of the JcDof genes, and normalized log2 transformed values were used with hierarchical clustering represented by the color scale (0–10). Blue indicates low expression, and red indicates high expression. The samples were: roots and leaves (salt- and drought-stressed at different times), and roots (BA treatment). The detailed information of expression data are described in Supplementary Tables S6 and S7.

