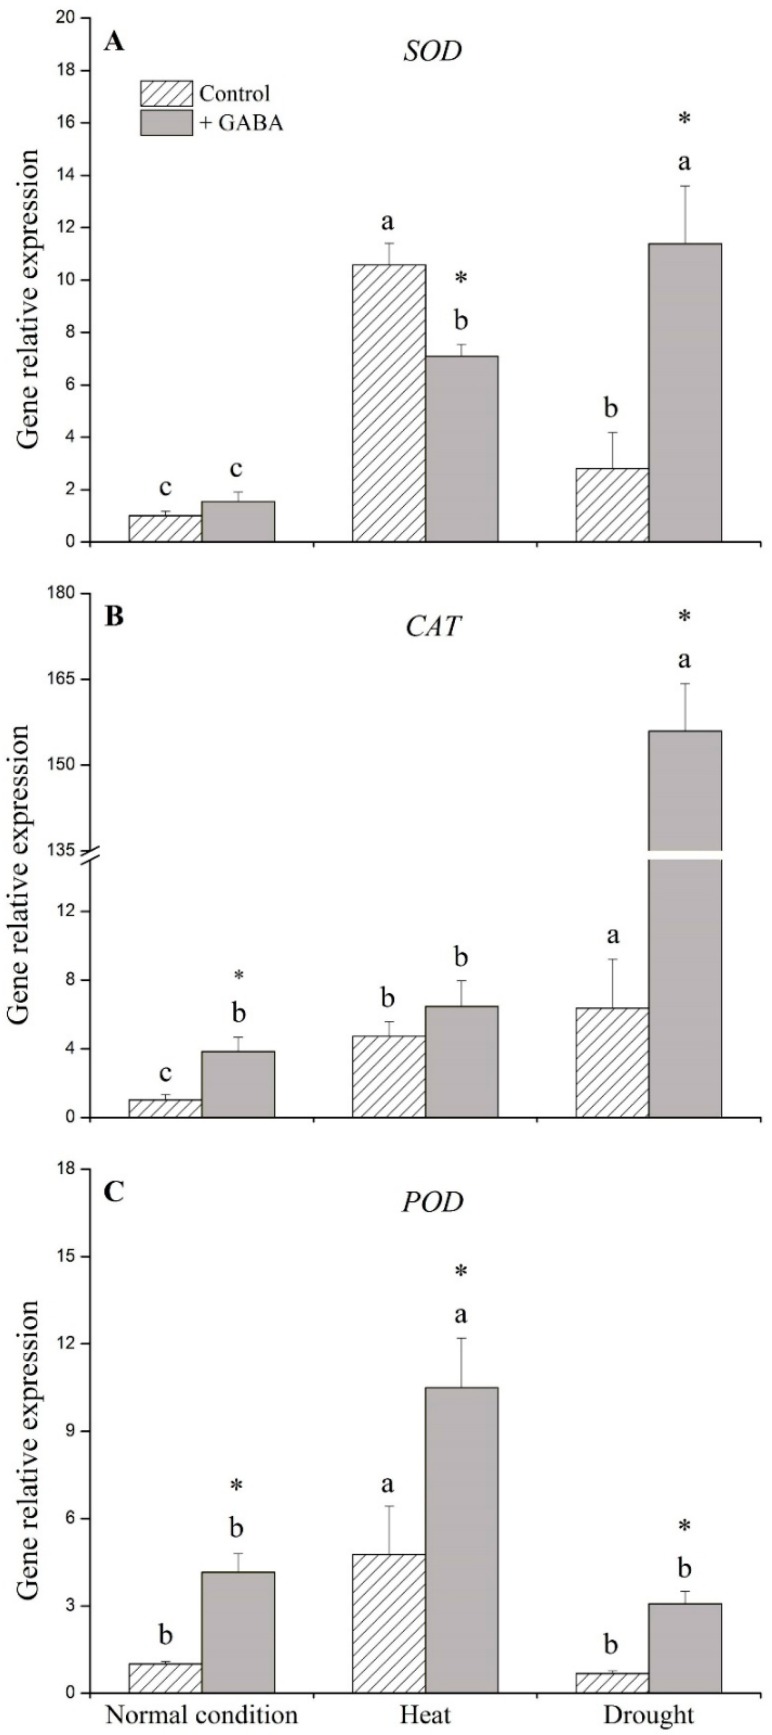
Figure 6.
Effects of γ-aminobutyric acid (GABA) on genes’ expression of (A) superoxide dismutase (SOD), (B) catalse (CAT), and (C) peroxidase (POD) under normal, heat, and drought conditions. Vertical bars indicate ±SE of mean (n = 4). Different letters above columns indicate significant differences for one particular treatment (control or +GABA) under different conditions; asterisk “*” indicates significant difference between control and +GABA treatment under a given condition.

