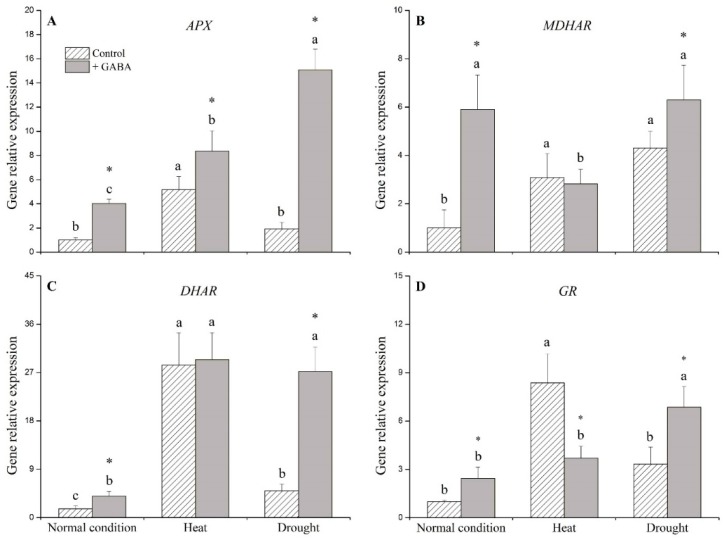
Figure 7.
Effects of γ-aminobutyric acid (GABA) on genes’ expression of (A) ascorbate peroxidase (APX), (B) monodehydroascorbate reductase (MDHAR), (C) dehydroascorbate reductase (DHAR), and (D) glutathione reductase (GR) under normal, heat, and drought conditions. Vertical bars indicate ±SE of mean (n = 4). Different letters above columns indicate significant differences for one particular treatment (control or +GABA) under different conditions; asterisk “*” indicates significant difference between control and +GABA treatment under a given condition.

