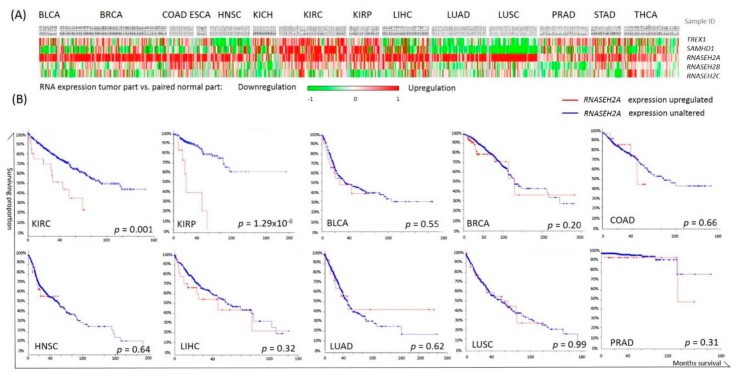
Figure 1.
Cancer nucleotide degrading enzyme gene expressions and their association with patient overall survival. (A) TREX1, SAMHD1, RNASEH2A, RNASEH2B, and RNASEH2C expression in each subject as compared with the corresponding normal tissues. Red indicates higher expression in tumor tissue and green indicates lower expression in cancer, as compared to normal tissues. Each column represents a patient sample of The Cancer Genome Atlas (TCGA) cancer cohorts. (B) Kaplan-Meier analyses of overall survival in patients with higher RNASEH2A expression (red line) or with unaltered RNASEH2A expression (blue line) calculated by cBioPortal software; p values were calculated by log-rank tests.

