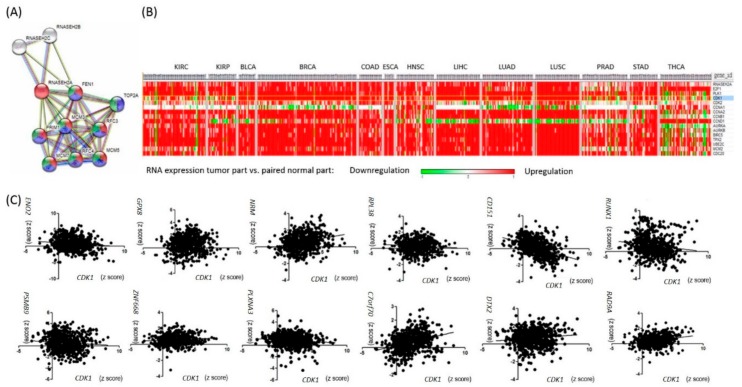
Figure 2.
Genes correlated with RNASEH2A expression. (A) RANSEH2A network analysis via STRING. Genes are enriched in pathways of DNA replication (red), mitotic cell cycle (blue), and cell cycle progression (green). (B) Expression profile of cell cycle-related genes in TCGA 13 cancer cohorts. CDK1 is marked in blue. (C) Pan-cancer gene expression analyses plotted in correlation with CDK1 expression.

