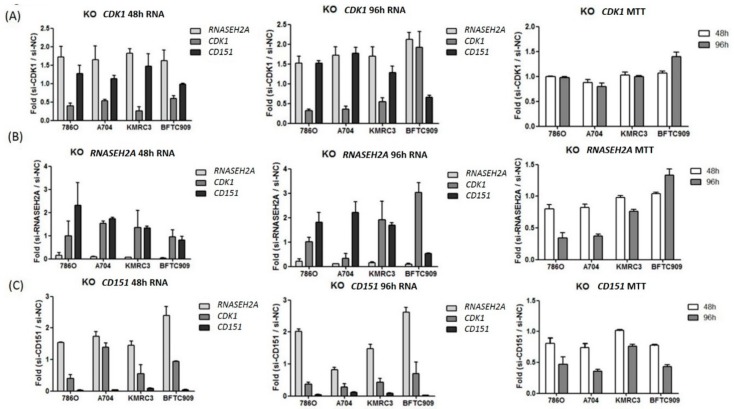
Figure 3.
Kidney cancer cell line knockdown (KO) studies. (A) si-CDK1 (B) si-RNASEH2A (C) si-CD151. Gene expression fold changes at 48 h (left graphs) and at 96 h (middle graphs) post-transfection and knockdown effects on tumor proliferation measured by MTT assays (right graphs) are shown. Bars represent mean ± SD, n = 3.

