Figure 4.
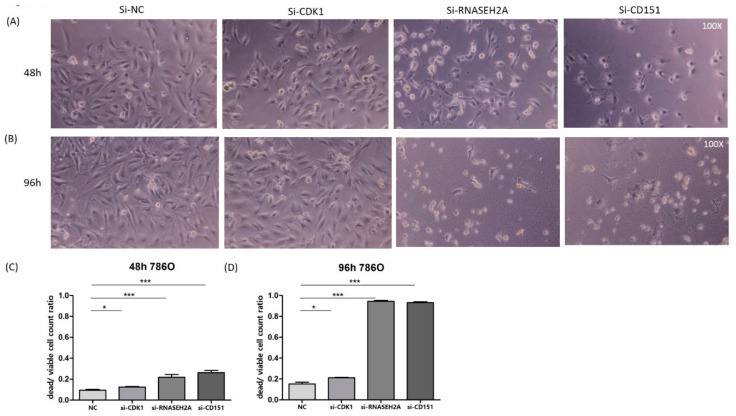
Cell viability assay in 786O cell line. (A,B) Light microscopy images of cells taken at 100× magnification, at 48 h (A) and 96 h (B) after transfection with si-NC (negative control), si-CDK1, si-RNASEH2A, or si-CD151. (C,D) Differential dead and viable cell count ratios in 786O cells transfected with si-NC, si-CDK1, si-RNASEH2A, or si-CD151 at 48 h (C) and 96 h (D). The bars represent mean ± SEM, n = 9; * p < 0.05; *** p < 0.0001 by Mann–Whitney U tests.

