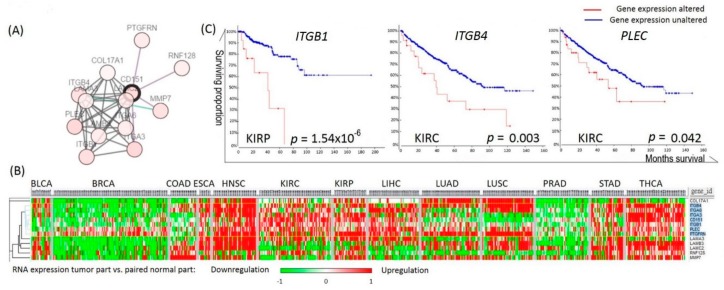
Figure 5.
Genes correlated with CD151 expression. (A) Interactome analysis of CD151 via cBioPortal. (B) Cluster analysis of genes correlated with CD151 expression in different cancers. Genes that correlated the most with CD151 are marked in blue. (C) Kaplan–Meier analyses of the overall survival in TCGA kidney cancer patients with or without altered gene expressions, calculated by cBioPortal.

