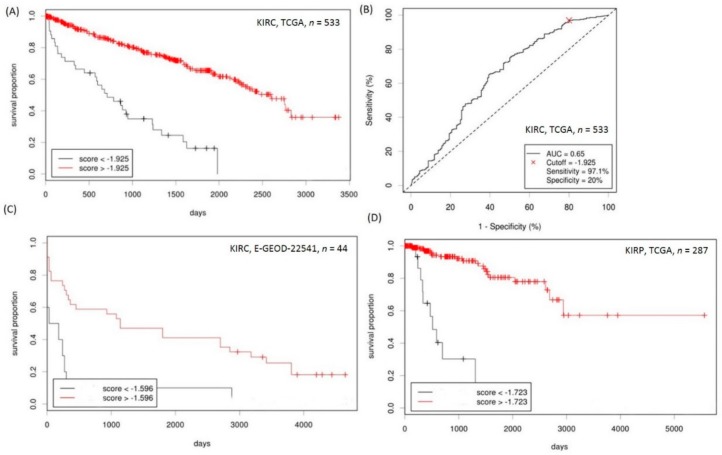
Figure 6.
Prediction of kidney cancer overall patient survival rate using scores derived from cancer expression profiles of RNASEH2A, CDK1, CD151, ITGB1, ITGB4, and PLEC. (A) Kaplan–Meier analysis of the TCGA KIRC patients’ overall survival based on the optimal cutoff score derived from the cutoff finder. (B) Receiver operating characteristic (ROC) curve plotted on the optimal cutoff score of the TCGA kidney renal clear cell carcinoma (KIRC) cohort. (C) Kaplan–Meier analysis of disease-free survival of the E-GEOD-22541 clear cell renal cell carcinoma (ccRCC) validation cohort based on the optimal cutoff score. (D) Kaplan–Meier analysis of the TCGA kidney renal papillary cell carcinoma (KIRP) patients’ overall survival based on the optimal cutoff score.

