
Figure 1.
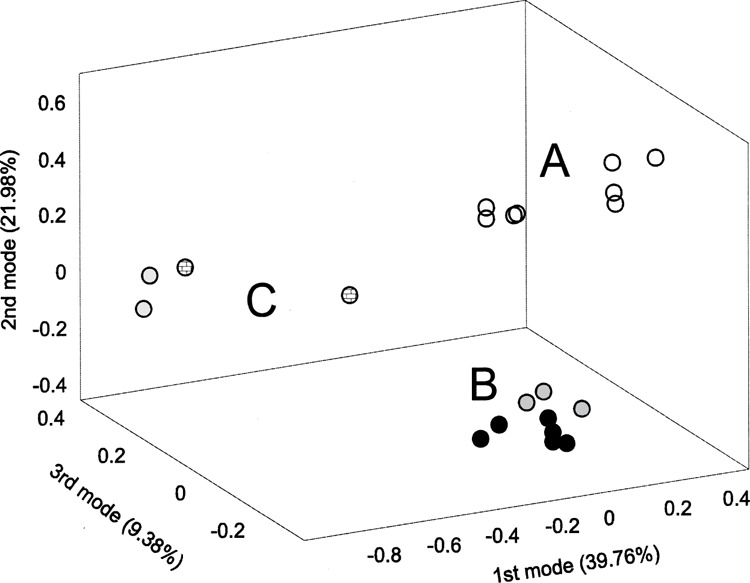
Singular Value Decomposition analysis of samples. The unsupervised analysis revealed distinct differences between control and treated samples (first principal component, 39.76% of variance) and showed other subdivisions between samples, mainly related to CoCl2 versus “true hypoxia” difference. A: control samples (open circles); B: “true hypoxia” samples (black circles: O2-regulated incubator samples; dark gray circles; Billups-Rothenberg chamber samples); C: cobalt chloride samples (light gray circles: 100 μM CoCl2 samples; checkered circles: 200 μM CoCl2 samples).