
Figure 2.
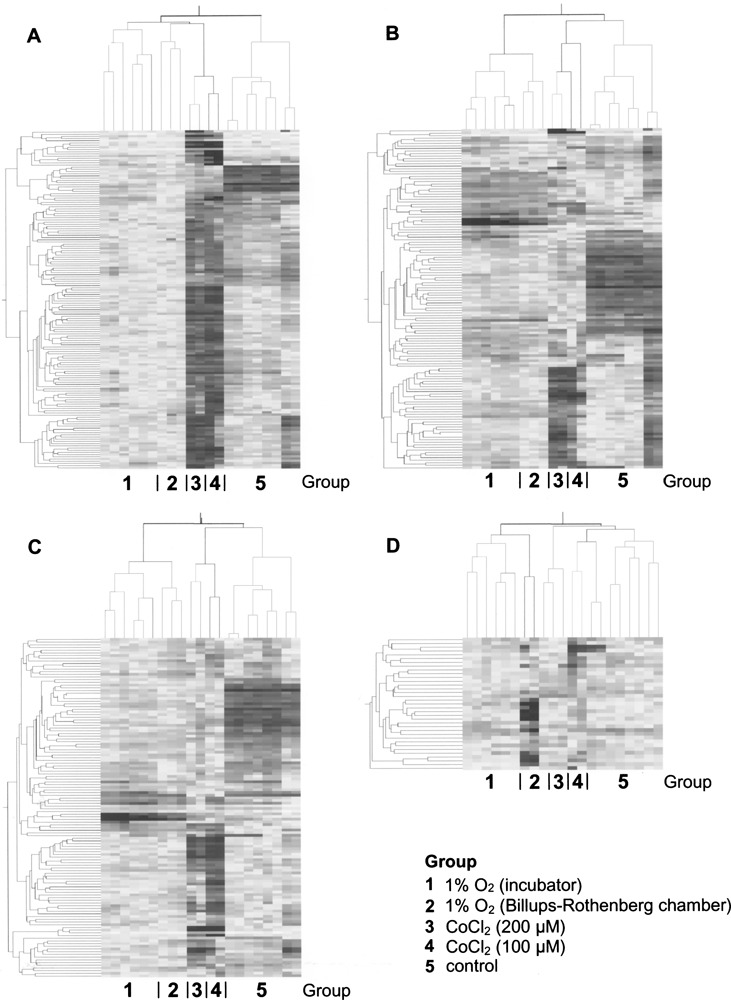
Hierarchical clustering of samples. The genes with expression profile similar to the first four SVD modes were used. The analysis revealed several different patterns of variability within analyzed samples. (A) First mode: control and treated samples show subdivision into two distinct branches. (B) Second mode: CoCl2-treated samples cocluster with controls. (C) Third mode: pattern of clustering similar to that of the second mode. (D) Fourth mode: O2-regulated incubator samples and 200 μM CoCl2 samples cluster into distinct branches.