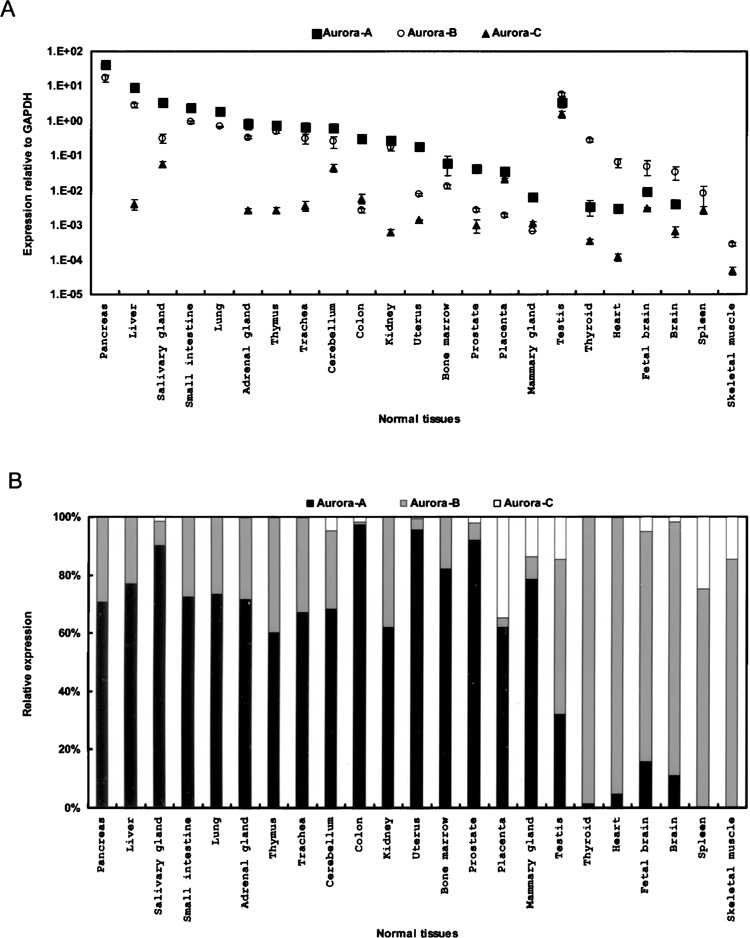
Figure 2.

Tissue-specific distribution of Aurora family members. (A) The gene expression profiles for Aurora-A (squares), -B (circles), and -C (triangles) were examined in 23 human tissues using quantitative RT-PCR, with data normalized to the GAPDH expression level. Values are presented as the mean ± SD. (B) To display the relative expression ratio, the expression of each Aurora member was normalized to that of the entire family.
