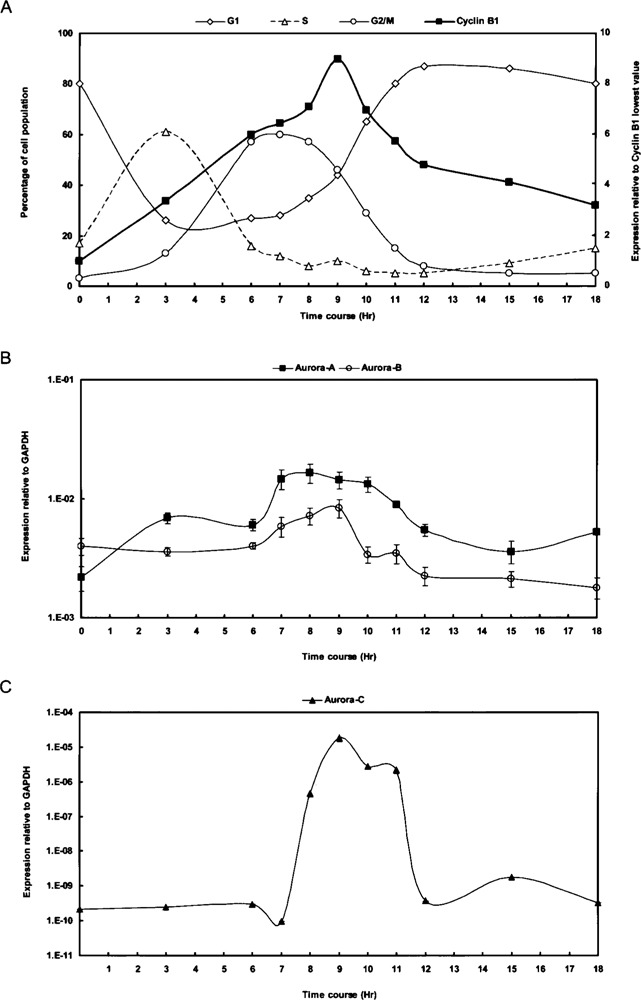
Figure 4.

Aurora family members exhibit periodical expression patterns in the M phase of the HeLa cell cycle. (A) A HeLa cell cycle panel was prepared by synchronizing cells at the G1/S border using double thymidine treatment. Cells were then released from the G1/S block by removing the chemicals. RNA samples were collected at various time points and used as templates for quantitative RT-PCR analysis. The percentages of cells at different phases of the cell cycle are plotted on the left (Y-axis; G1 phase, diamonds; S phase, triangles; G2/M phase, circles). The relative expression of cyclin B1 (squares), indicative of the G2/M phase, is plotted on the right (Y-axis). FACS analysis, in accordance with the expression of the cell cycle marker cyclin B1, indicates that the cells reached the G2/M phase at 6–10 h, with the peak of mitosis occurring at 9 h. (B, C) Gene expression patterns of Aurora-A (squares) and Aurora-B (circles) are shown in (B), whereas that of Aurora-C (triangles) is shown in (C) due to its low expression level. Data were normalized to the GAPDH expression level. Values are presented as the mean ± SD.
