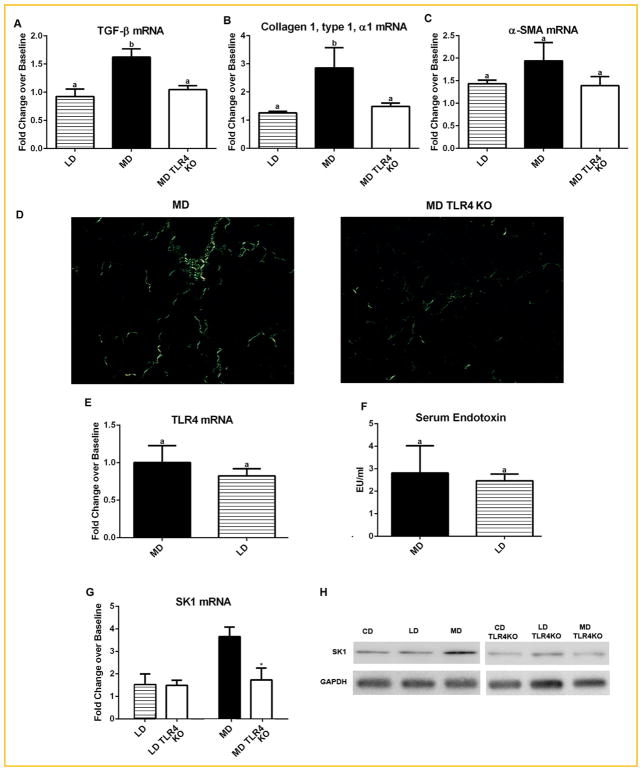
Fig. 4.
Effects of TLR4 KO on fibrotic change in the liver, endotoxin levels, and SK1. (A) MD induced expression of TGF-βwas not present MD TLR4 KO mice. (B) Expression of collagen I (Col1a1), and (C) α-smooth muscle actin (Acta2, α-SMA). MD TLR4 KO mice did not show increased expression of collagen as seen in MD. A similar trend was present for α-SMA, though not significantly. Data are presented as fold changes over level of CD (Baseline). (D) Representative micrographs of liver sections stained with picrosirius red and acquired under plane polarized light. (E) Hepatic TLR4 mRNA expression relative to CD mice. No significant difference was noted in TLR4 expression between MD and LD. (F) Serum endotoxin (LPS) levels as measured by limulus amebocyte lysate (LAL) assay. Data are presented as fold changes over level of CD (Baseline). No difference was noted between the means of both diets. (G) Hepatic expression sphingosine kinase 1 (SK1) in MD and LD fed animals. TLR4 KO (TLR4) animals showed a significant decrease in expression of SK1 as compared to wild-type (Wt) MD animals. TLR4 KO did not affect SK1 expression in LD mice. (H) Protein levels of SK1 measured by Western blot analysis showing increased SK1 mRNA corresponds to increased protein levels. Data are presented as fold changes over level of CD (Baseline). Means with different lettered subscripts within each group are significantly different from each other, P <0.05. *P <0.05 versus Wt. Data are expressed as mean ± SEM; n = 5–6.

