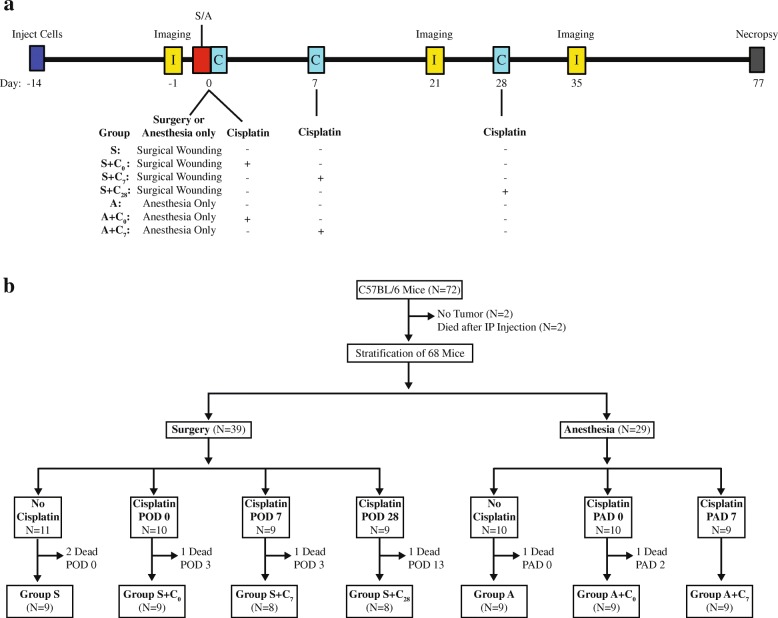
Fig. 3.
Study treatment paradigm. a Schematic showing the overall treatment and imaging schedule used in the study. b Schematic showing the stratification of imaged animals to the seven treatment groups and the loss of animals within groups. S = surgery, A = anesthesia, C0 = cisplatin on the perioperative day, C7 = cisplatin on postoperative day (POD) 7, C28 = cisplatin on POD 28. All animals were inoculated i.p. with 5 million ID8-L11 cells and were imaged 13 days later

