
Fig. 4.
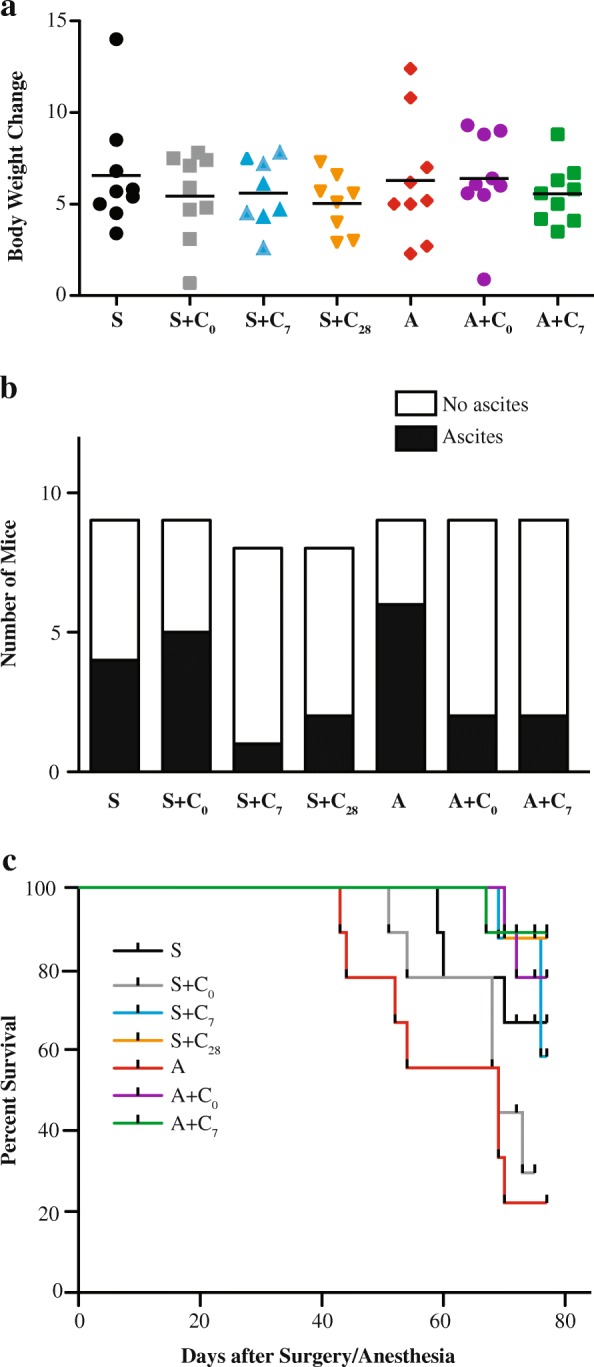
Change in body weight, incidence of ascites (Panel b) and survival curves for the seven treatment groups. a Change in body weight from the time of cell injection to animal sacrifice is shown for each treatment group. Lines represent group mean. No changes were detected using ANOVA. b Numbers of mice that exhibited signs of ascites development within the treatment groups. No overall effect due to treatment group was detected using a Chi-square analysis. c Kaplan-Meier growth curves obtained for each of the treatment groups using indicators of animal health/distress as a surrogate for survival. An overall effect of treatment was indicated by a Log-Rank test (p = 0.0012)