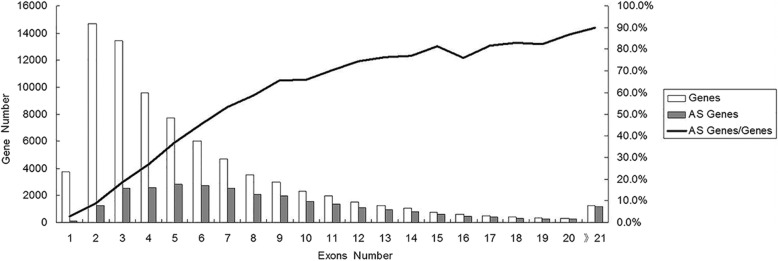
Fig. 3.
Comparison of the exon number between the total genes and AS genes in peanut genome. The number in X axes indicated the number of exons contained in the genes, the left Y axes indicated the number of the genes containing these exons, and the right Y axes indicated the ratio of AS genes/total genes with the same number of exons

