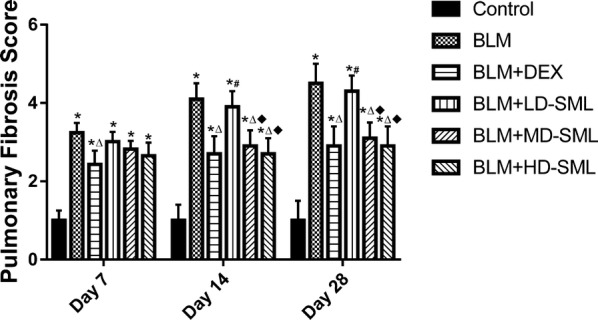
Fig. 3.

Quantitative evaluation of fibrotic changes (fibrotic tissue and collagen) in the lung sections by Ashcroft scoring at 7, 14 and 28 days of treatment. Each value is expressed as mean ± S.D. (n = 5). Results are statistically significance at p < 0.05. *p < 0.05 vs control; ∆p < 0.05 vs BLM; #p < 0.05 vs BLM + DEX; ■p < 0.05 vs BLM + LD-SML, by two-way ANOVA followed by Tukey’s multiple comparisons test. LD low-dose, MD medium-dose, HD high-dose
