Fig. 3.
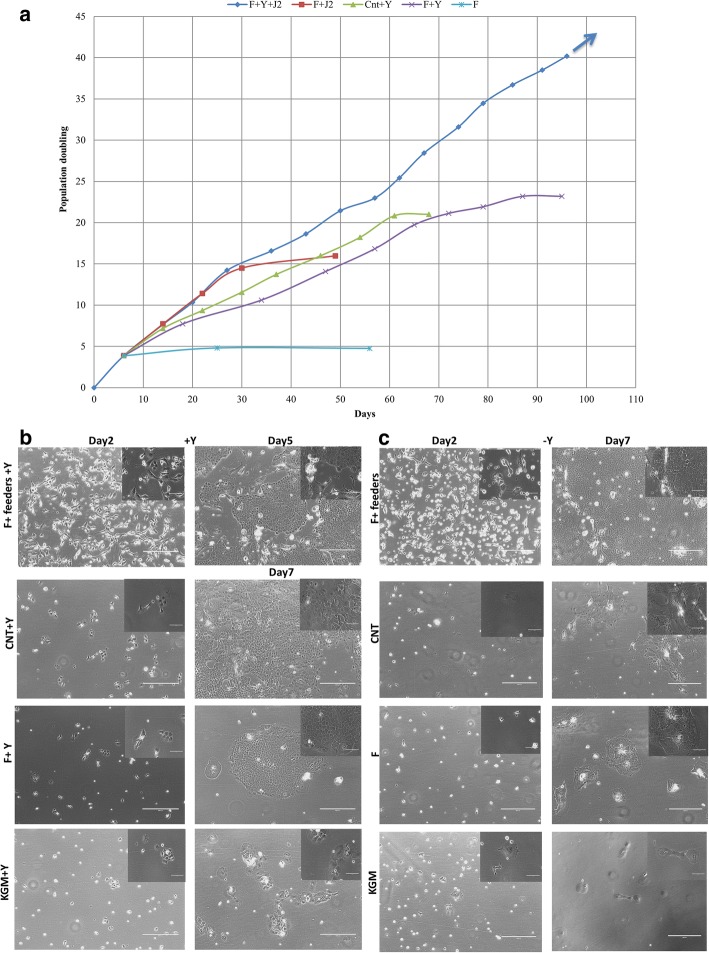
Equine keratinocyte growth was tested in various culture conditions with or without 10 uM Y-27632. (a) Growth curve was generated to represent growth rate by plotting population doubling over days in time (graph shows the average of replicates). The arrow indicates cells that continued to divide indefinitely. Phase contrast images of primary equine keratinocytes (EK-1547) cultured in co-culture with irradiated fibroblasts, CNT, F, and KSFM with (b) or without Y-27632 (c). All images were taken on day 2 and day 7 following initial culture without passage (day 5 for feeders+Y condition due to 95% confluency) (×10 magnification. Size bars = 400 μm). Top right images show enlarged magnification (×40 magnification, size bars = 100 μm)

