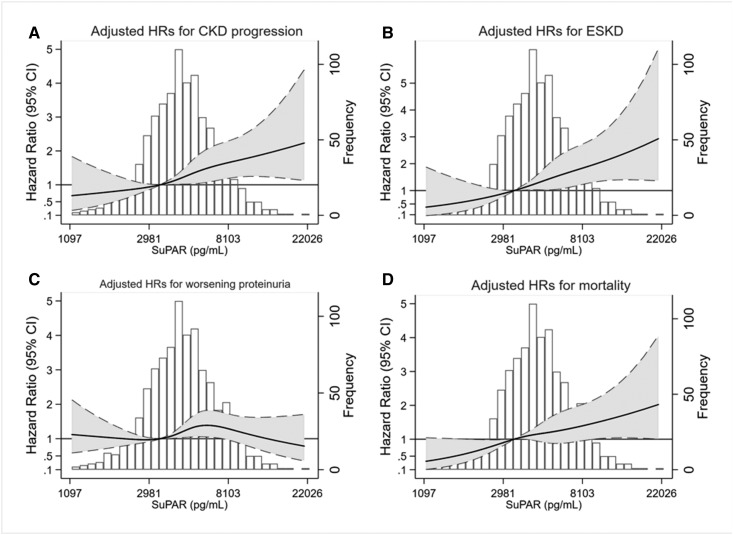
Figure 2.
The adjusted HRs for CKD progression, ESKD, and mortality increased log-linearly with higher levels of baseline suPAR in the African-American Study of Kidney Disease and Hypertension. Solid lines indicate adjusted HRs. Shaded areas indicate 95% CIs. Dashed lines indicate upper and lower limits of 95% CIs. (A) Adjusted HRs for CKD progression plotted against baseline suPAR concentration on a log-scale. (B) Adjusted HRs for ESKD plotted against baseline suPAR concentration on a log-scale. (C) Adjusted HRs for worsening proteinuria plotted against baseline suPAR concentration on a log-scale. (D) Adjusted HRs for mortality plotted against baseline suPAR concentration on a log-scale. HRs were adjusted for demographics (age and sex), AASK trial arm (BP control goal and trial medication), kidney measures (UPCR and measured GFR), and clinical risk factors (history of heart disease, history of smoking, CRP, and APOL1 risk status) at baseline. CKD progression was defined as doubling of serum creatinine from baseline or ESKD (requiring dialysis or kidney transplantation). Worsening proteinuria was defined as pre-ESKD doubling of 24-hour UPCR to ≥220 mg/g.

