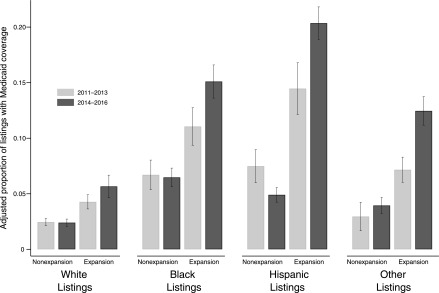
Figure 3.
Medicaid expansion was associated with larger percentage-point increases in Medicaid coverage for pre-emptive listing among racial and ethnic minority listings compared to white listings. This figure displays results from a race-adjusted multinomial logistic regression model for insurance type at listing comparing 19 nonexpansion states to states that expanded Medicaid on January 1, 2014 (n=24+DC). The estimates were derived from the triple interaction of race/ethnicity, Medicaid expansion state, and pre- and postexpansion period. Each bar represents the adjusted proportion, with 95% confidence intervals, of Medicaid-covered listings within each listed race/ethnicity group in expansion states and nonexpansion states, respectively. Light gray bars represent the adjusted pre-expansion proportions, and dark gray bars represent postexpansion adjusted proportions.

