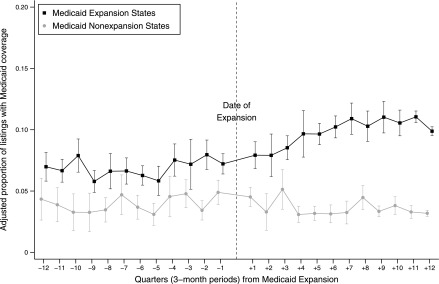
Figure 4.
Including all states that expanded Medicaid by their dates of expansion, Medicaid expansion was associated with an increase in pre-emptive listings with Medicaid coverage. This figure displays results from a race-adjusted multinomial logistic regression model for insurance type at listing comparing 19 nonexpansion states to 31 expansion and late-expansion states and the District of Columbia. To account for different calendar dates of Medicaid expansion, results are presented as the number of quarters before and after a standardized Medicaid expansion date, where the date of Medicaid expansion adoption is set to equal zero. The point estimate for each quarter indicates the adjusted proportion of all pre-emptive listings in that quarter that was Medicaid-covered. The dashed line indicates the calendar date of Medicaid expansion. Black squares represent proportions of Medicaid-covered pre-emptive listings in Medicaid expansion states, with 95% confidence intervals. Gray circles represent proportions of Medicaid-covered pre-emptive listings in nonexpansion states, with 95% confidence intervals.

