Figure 1.
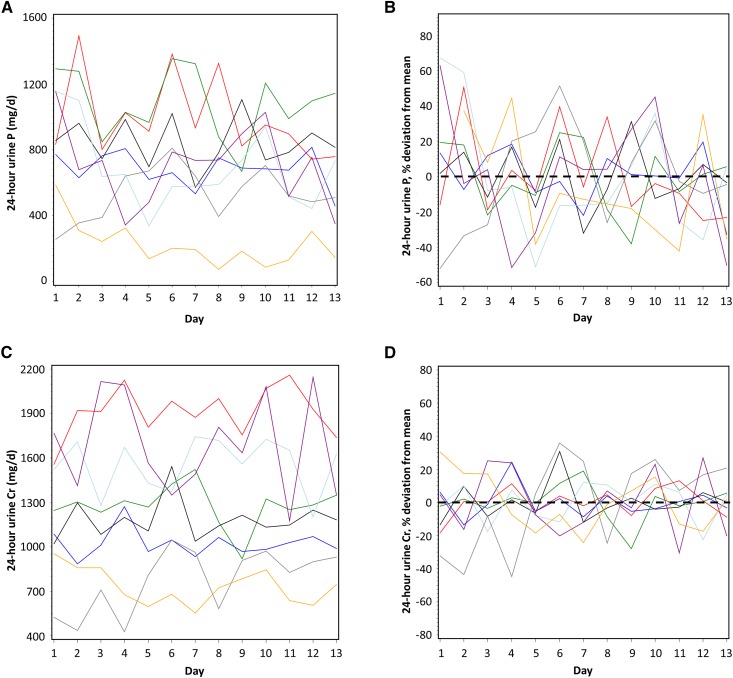
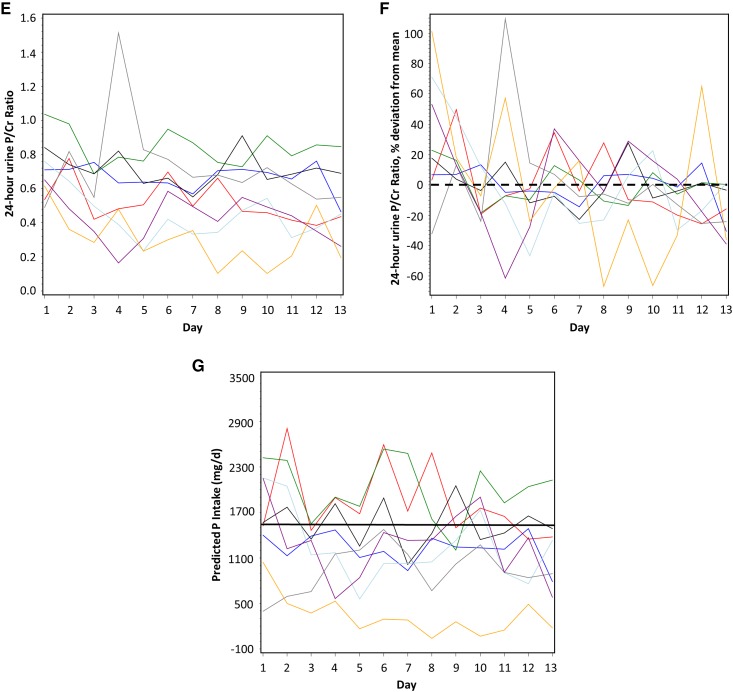
Twenty four-hour urine phosphorus was highly variable within and among patients with CKD. Daily variation in subjects in (A) 24-hour urine phosphorus (absolute values) and (B) 24-hour urine phosphorus (% variation above and below the 13-day mean [set at zero] for each subject); (C) 24-hour urine creatinine (absolute values) and (D) 24-hour urine creatinine (% variation above and below the 13-day mean [set at zero] for each subject); (E) 24-hour urine phosphorus-to-creatinine ratio (absolute values) and (F) 24-hour urine phosphorus-to-creatinine (% variation above and below the 13-day-mean [set at zero] for each subject); and (G) predicted dietary phosphorus intake calculated on the basis of 24-hour urine phosphorus (see Materials and Methods). In (G), the measured, controlled level of phosphorus intake is shown by the horizontal black line. In (B, D, and F), the mean for each subject is set at zero and the % fluctuation each day above or below the mean is shown; zero is indicated by a horizontal black dashed line. In all panels, different color lines represent individual subjects. Cr, creatinine; P, phosphorus; P/Cr, phosphorus-to-creatinine.


