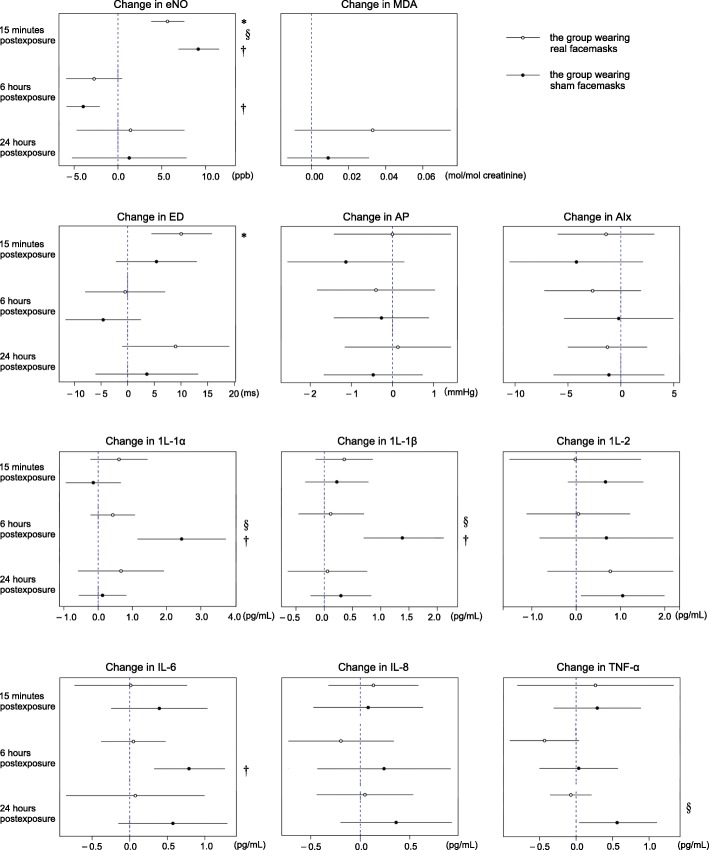
Fig. 5.
Mean changes of biomarkers (95% CI) compared to the pre-exposure (1st) test in the subjects. * Significantly different from baseline in the group wearing real facemasks, p < 0.005
† Significantly different from baseline in the group wearing sham facemasks, p < 0.005.
§Significantly different between the groups wearing real and sham facemasks in the test, p < 0.005.

