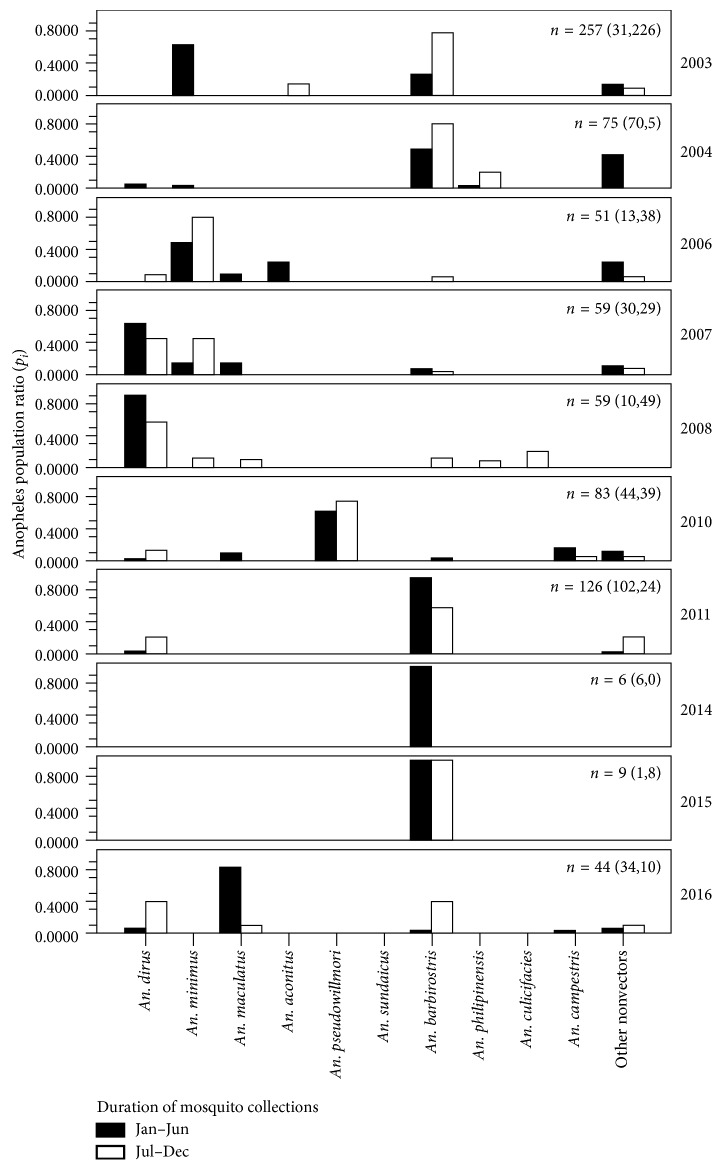
Figure 6.
Anopheles populations adapted to the sampling site I based on baseline entomological surveillance data of Anopheles vector populations from the Anopheles sampling site I from 2003 to 2016. Variations of species composition and abundance are shown. The total number and the numbers (in parenthesis) collected between the first-half (front number, January to June) and the second-half (rare number, July to December) of each year are presented. The Anopheles population ratios (p i) were expressed by the number of individual species divided by the total number of all species observed at time of collection. Data were modified from the VBDC 6.4 Trat.

