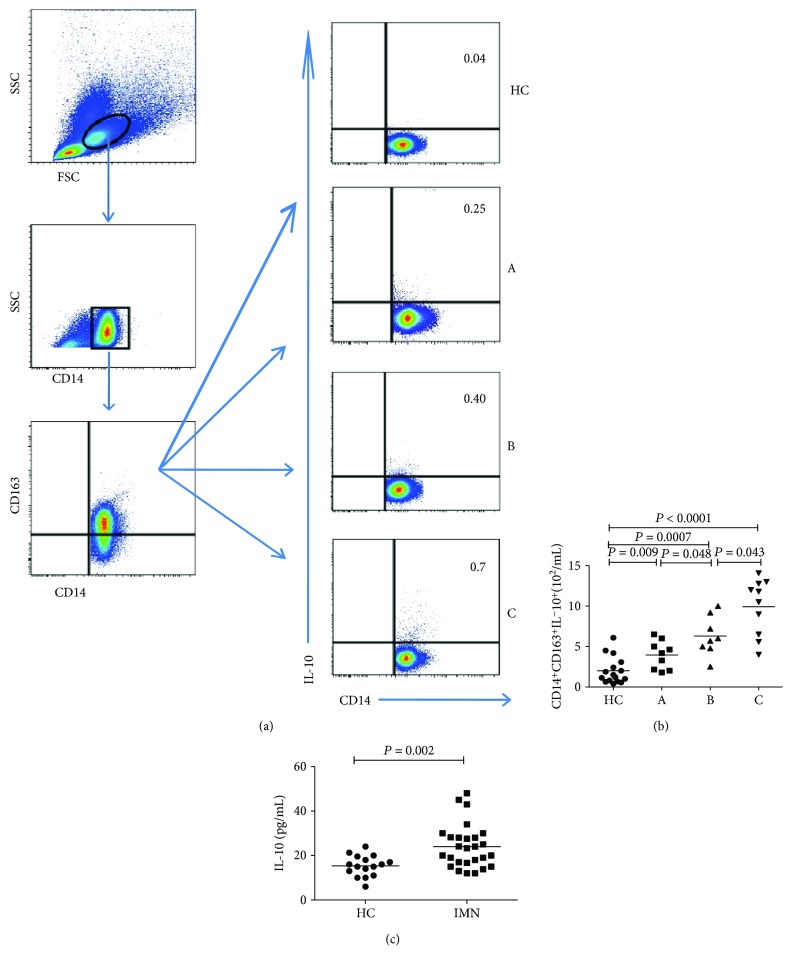
Figure 3.
Analysis of IL-10+ M2 monocytes and the concentrations of serum IL-10. PBMCs were obtained from all subjects and stimulated in vitro. The cells were stained in duplicate with anti-CD14 and anti-CD163, then fixed and permeabilized, following the staining with anti-IL-10. The numbers of CD14+CD163+IL-10+ M2-like monocytes in all participants were analyzed by flow cytometry. The concentrations of serum IL-10 were determined by ELISA. Data are representative charts or the mean numbers of the monocyte subsets and the mean values of serum IL-10 in all groups. The horizontal lines indicate the median values.

