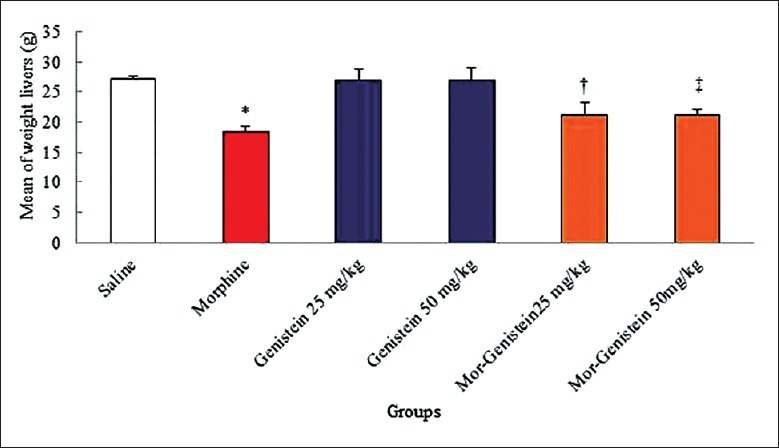
Figure 1.

Forty-eight mice were equally divided into six groups. *Significant decrease of liver weight in morphine group compared to saline group (18.50 ± 0.90 g vs. 27.15 ± 0.50 g, χ2 = 22.450, P = 0.001). †,‡Significant increase in genistein plus morphine groups compared to morphine group (25 mg/kg: 21.15 ± 2.13 g vs. 18.50 ± 0.90 g, χ2 = 19.251, P < 0.0001; 50 mg/kg: 21.20 ± 1.00 g vs. 18.50 ± 0.90 g, χ2 = 19.502, P < 0.0001, respectively).
