
Figure 10.
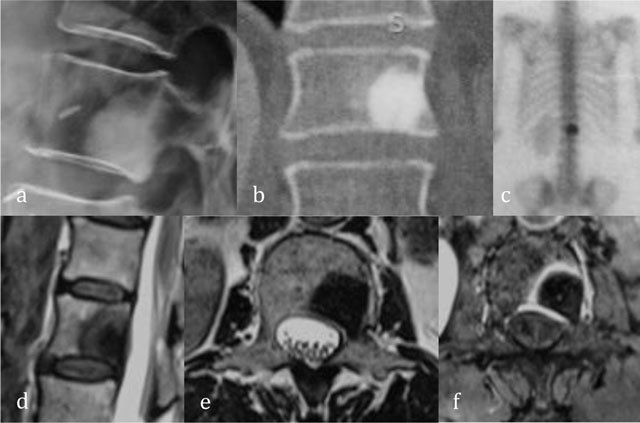
Enostosis of L1. Radiograph (a) and coronal reformatted CT (b) show a focal area of dense bone similar to cortical bone. Bone scintigraphy (c) show an avid uptake. Sagittal T2-WI (d), axial T2-WI (e) and axial T1-WI after administration of gadolinium contrast (f) show central low signal intensity surrounded by intermediate T2 signal and peripheral enhancement.