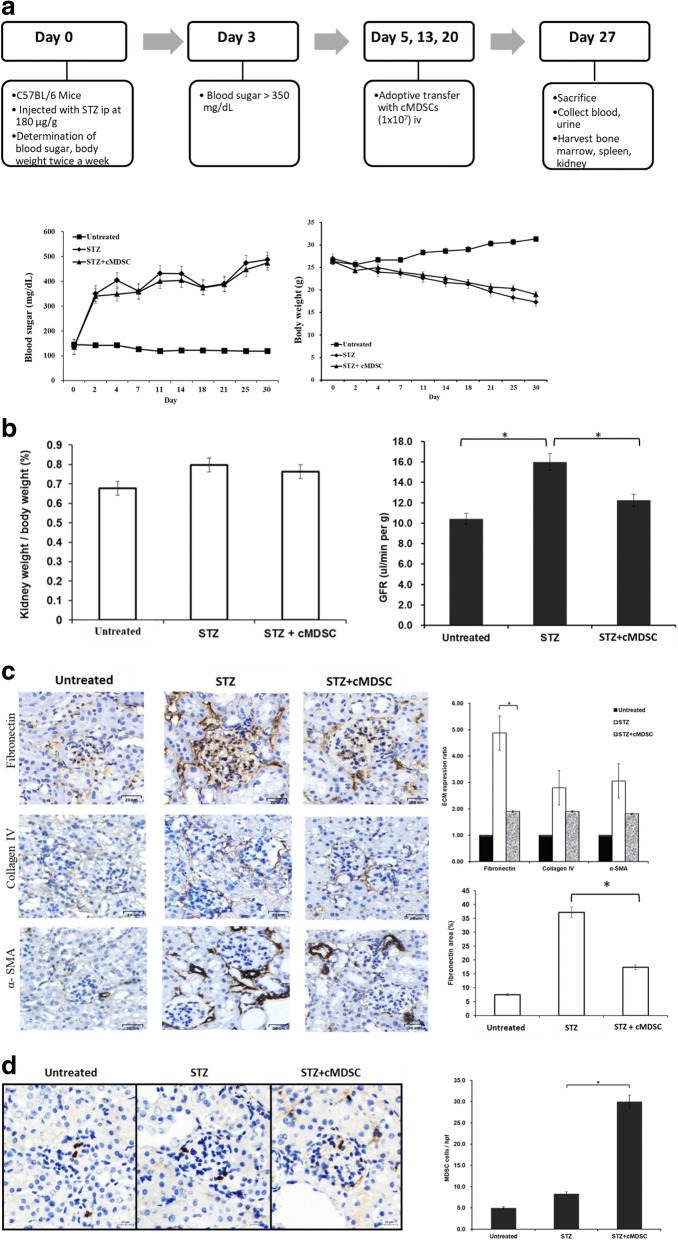
Fig. 3.
Adoptive transfer of cMDSCs into STZ-treated diabetic mice. a Cytokine-induced MDSCs (1 × 10⁷ cells) adoptively transferred into STZ mice through pudendal vein once a week (on days 5, 13, and 20). Mice in each group then sacrificed on day 27 (upper panel). Blood sugar levels and body weight (lower panel) measured twice a week until mice sacrificed in subgroups of untreated mice (untreated, n = 5), STZ-treated diabetic mice (STZ, n = 5), and cMDSC-treated STZ mice (STZ + cMDSC, n = 5). b Kidneys harvested and weights measured on day 27. Ratios of kidney weight to body weight of the three groups compared (left panel). GFRs of the three groups examined and compared (right panel) (*P < .05). c Kidney cryostat sections histochemically stained with anti-fibronectin mAb, anti-collagen type IV mAb, or anti-alpha-smooth muscle actin mAb (left panel, brown; 400× magnification) and examined using a microscope. Bar graph presents quantification of ECM expression of renal cortex of untreated mice, STZ mice, and cMDSC-treated STZ mice (right upper panel) (*P < .05). Areas of fibronectin expression within the glomeruli of the three groups quantified (right lower panel) (*P < .05). d Presence of MDSCs in kidneys analyzed through histochemical staining with anti-Gr-1 mAb (left panel, brown; 400× magnification) and examined using a microscope. Bar graph illustrates positive MDSCs counted in a total of 10 high-power fields randomly selected in each section (right panel) (*P < .05). α-SMA alpha-smooth muscle actin, cMDSC cytokine-induced myeloid-derived suppressor cell, ECM extracellular matrix, GFR glomerular filtration rate, iv intravenous, STZ streptozotocin

