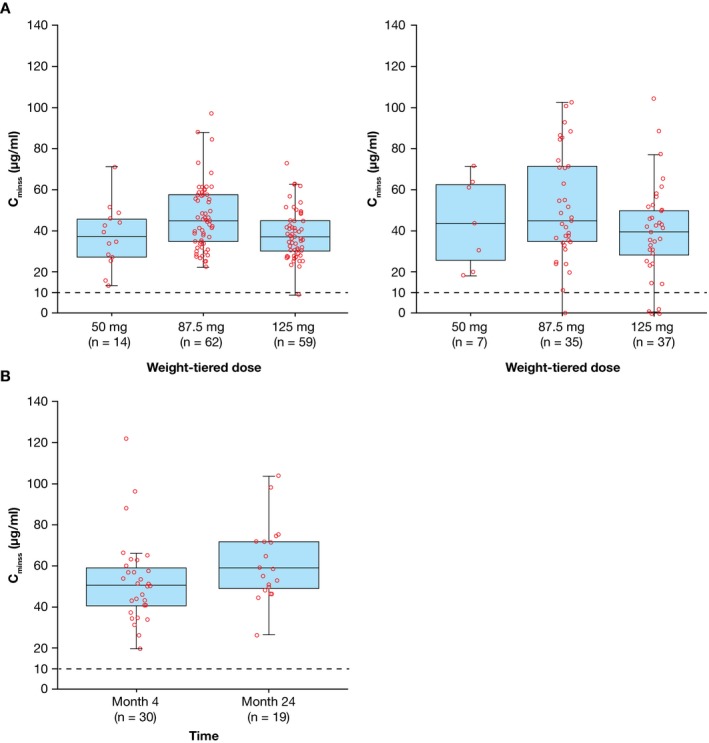
Figure 2.

Abatacept steady‐state trough concentration (Cminss) in patients ages 6–17 years (cohort 1) by weight group (A) at month 4 (left) and month 24 (right), and patients ages 2–5 years (cohort 2) at months 4 and 24 (B). Cminss was summarized for treated patients (≥1 dose of study medication) with evaluable pharmacokinetic measurements at each time point. Data are shown as box plots. Each symbol represents a single subject. Boxes represent the upper and lower interquartile range. Lines inside the boxes represent the median. Whiskers represent the 5th and 95th percentiles. Dashed lines indicate the target therapeutic concentration.
