
Figure 4.
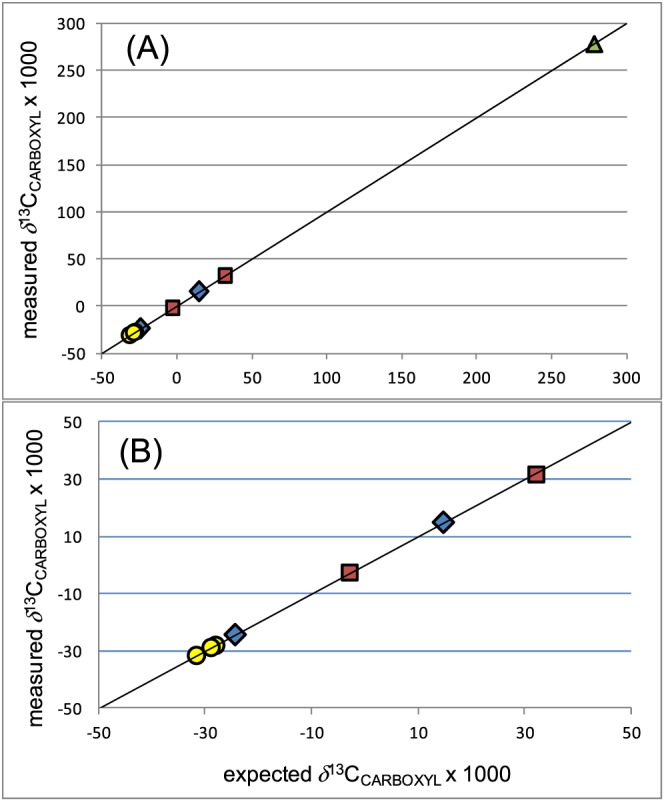
Measured versus expected δ 13CCARBOXYL values for amino acids (from Table 4) showing (A) full data range and (B) excluding USGS41a. Triangle (green) = glutamic acid, circles (yellow) = alanine, diamonds (blue) = glycine, squares (red) = valine. Solid line shows a 1:1 relationship. Expected values were either measured off‐line or calculated based on production notes for mixtures of unlabelled and enriched compounds assuming 96% label at the α‐carboxyl position, as detailed in the supporting information. Alternative calculations assuming 99% labels are also presented in Table 4 and shown in the supporting information [Color figure can be viewed at http://wileyonlinelibrary.com]