Figure 1.

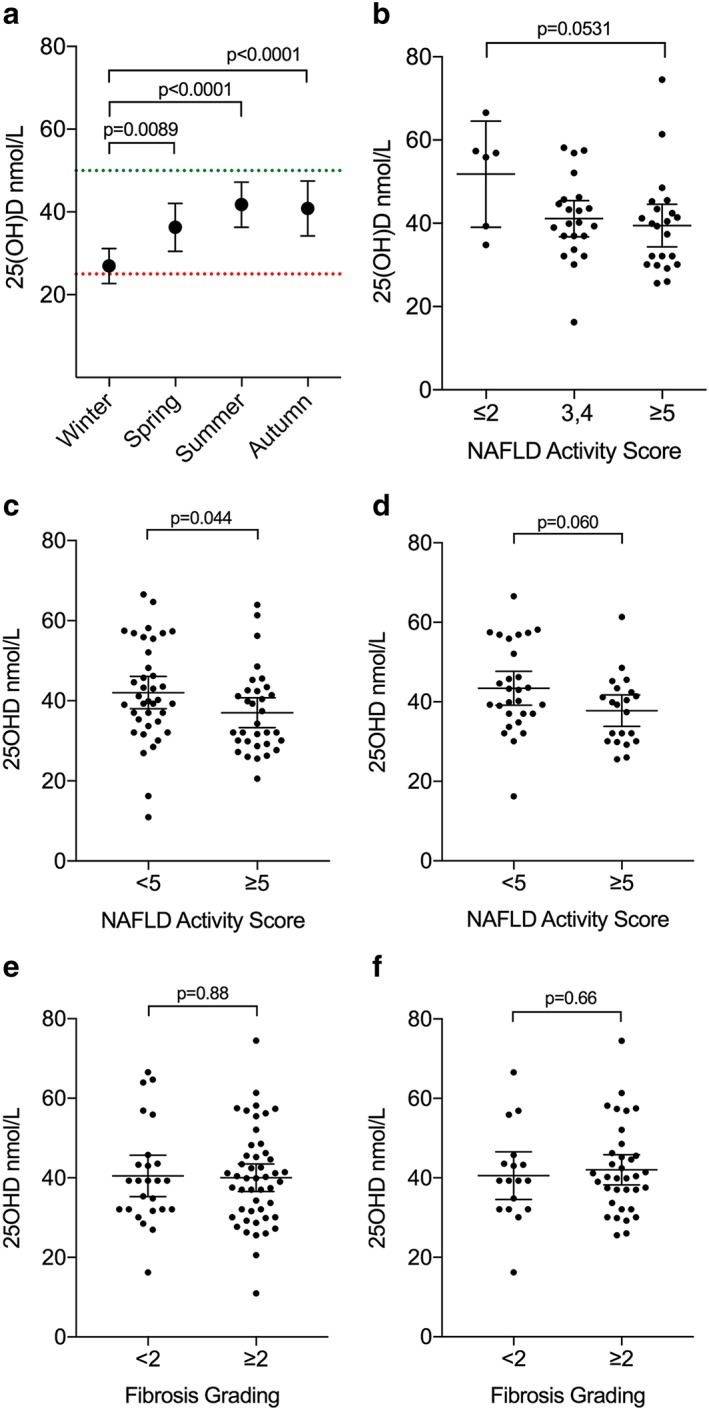
Serum 25OHD levels and histological grading. (a) Independent and repeated measures of serum 25OHD levels of cohort. Dashed lines shows accepted thresholds for deficiency (red) and insufficiency (green). (b) In Caucasian patients, Brunt/Kleiner NAS grading vs. predicted August 25OHD status demonstrates lower levels in patients with more severe disease using standard cut‐offs for simple steatosis (score 0–2), Borderline NASH (3–4) and NASH (5–8). (c) Utilizing a score of <5 and ≥5 to define severity of disease, those with less severe disease had significantly lower 25OHD in the group as a whole, with a similar trend in Caucasian patients only (d). Fibrosis grading vs. predicted August 25OHD status in all patients (e) and Caucasian patients (f) are shown. 25OHD levels are expressed around the mean ± 95% CI; data were tested for normality using the D'Agostino and Pearson omnibus normality test and analysed using an unpaired t‐test. 25OHD, 25‐hydroxyvitamin D; NASH, nonalcoholic steatohepatitis.
