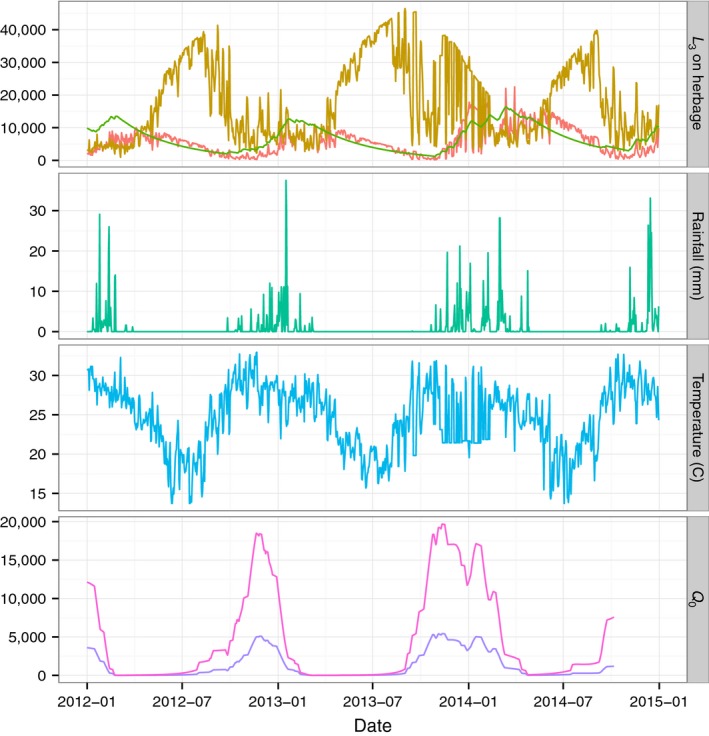
Figure 3.

Predicted L 3 on pasture for 2012–2015 using climate data from Gweta (east of the park). Top panel shows three models, standard model (red line), constant temperature (green line), constant precipitation (brown line). Middle panels show climate data used in the standard model: rainfall (green line); temperature (blue line); bottom panel, Q 0 for the same time period, with (purple line) and without (pink line) seasonal grass growth (NDVI)
