
Figure 4.
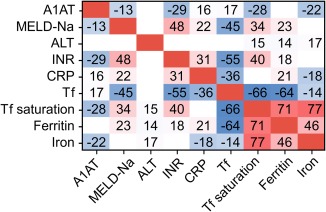
Correlation matrix among A1AT plasma concentration, markers of liver disease, inflammation, and iron metabolism. Tile colors code for direction and magnitude of the correlation. The first 2 decimal digits of ρ are displayed. Only significant correlations are shown.