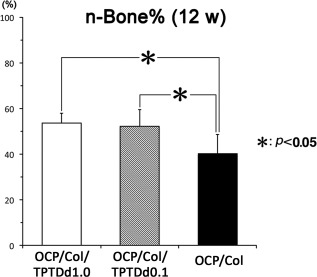
Figure 5.

Quantitative analysis of newly formed bone in defects. The percentage of newly formed bone in defects (n‐Bone%) ± SD is shown in OCP/Col/TPTDd1.0 (white square), OCP/Col/TPTDd0.1 (hatched square), and OCP/Col (black square). A significant difference is observed in mean values between OCP/Col/TPTDd1.0 and OCP/Col, and between OCP/Col/TPTDd0.1 and OCP/Col. Data are shown as the mean ± SD of six specimens.
