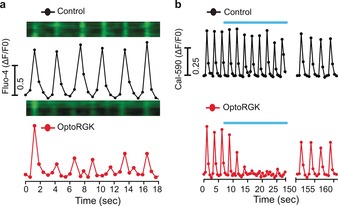
Figure 3.

OptoRGK‐mediated light‐inducible inhibition of the rhythmic oscillations of cytosolic Ca2+ in cardiac cells. a) Ca2+ oscillations reported by Fluo‐4 in HL‐1 cells with (bottom) and without (top) expression of optoRGK. Kymographs of Fluo‐4 signals in a representative HL‐1 cell are shown above the traces. Excitation was set at 488 nm to record Fluo‐4 signals while simultaneously photoactivating optoRGK. b) Ca2+ oscillations in HL‐1 cells monitored by Cal‐590. Blue bar=blue light illumination at 470 nm (40 μW mm−2).
