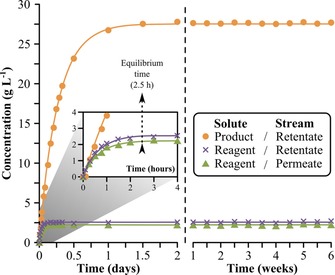
Figure 8.

Concentration profile in the nanofiltration unit. The curves show the simulated values and the symbols show the experimental data. The system was operated in the start‐up process configuration (Figure 7 A) until steady‐state concentration was reached (at 2.5 h) for the reagent in the permeate stream. At that point recycling of the permeate stream was commenced.
