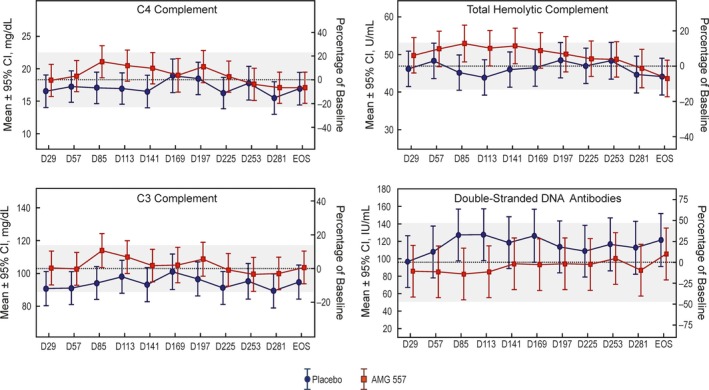
Figure 1.

Biomarker analyses showing postdose changes in complement and double‐stranded DNA. The dotted lines show the estimated pretreatment (baseline) mean analyte level in the study population (n = 20). The shaded bands represent the 95% confidence intervals (95% CIs) for the baseline means. The x‐axis indicates the nominal time points in days. The y1‐axis (left) is the analyte level, and the y2‐axis (right) is the estimated study population mean analyte level as a percentage of baseline. All available clinical study samples were analyzed, typically resulting in 10 observations per time point per dose. For some time points, there are as few as 8 observations.
