. 2018 Apr 17;125(8):991–1000. doi: 10.1111/1471-0528.15205
© 2018 World Health Organization; licensed by John Wiley & Sons Ltd on behalf of Royal College of Obstetricians and Gynaecologists
This is an open access article distributed under the terms of the https://creativecommons.org/licenses/by/3.0/igo/legalcode/ which permits unrestricted use, distribution and reproduction in any medium, provided that the original work is properly cited.
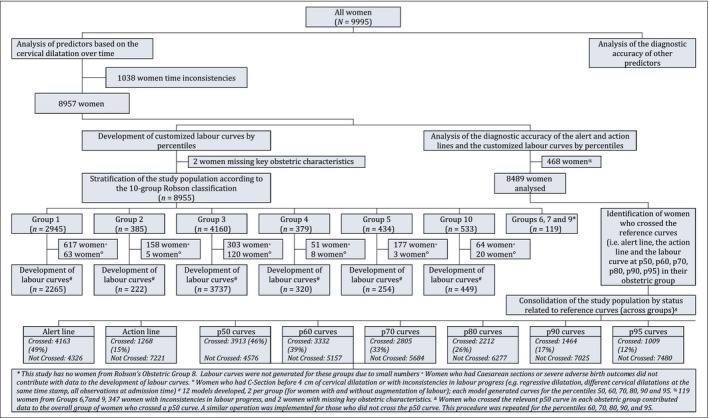
Figure 1.

The analysis flowchart.
