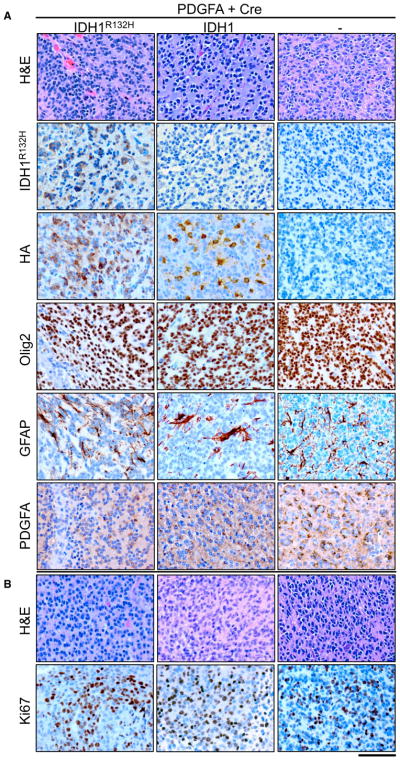
Figure 3. Histological Examination of Gliomas from N::TVA;Cdkn2alox/lox;Atrxlox/lox; Ptenlox/lox-Injected Mice.
(A) Representative H&E and IHC images for indicated antibodies IDH1R132H, HA, Oligo2, GFAP, and PDGFA for gliomas from each cohort of mice injected with viruses containing PDGFA and Cre alone (right column) or in combination with IDH1R132H (left column) or WT IDH1 (middle column).
(B) Representative high-power H&E and Ki67 images of tumors generated in mice injected with viruses containing PDGFA and Cre alone (right column) or in combination with IDH1R132H (left column) or WT IDH1 (middle column) as indicated. Scale bar represents 100 μm.
See also Figures S3 and S4.

