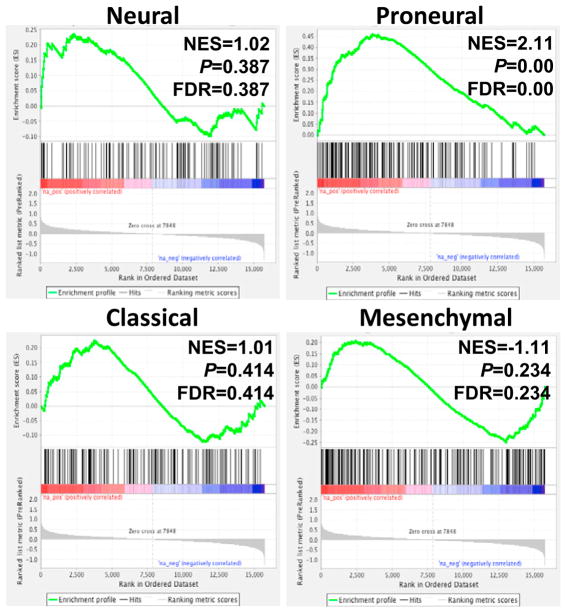
Figure 5. GSEA Comparison between Mouse and Human GBM.
GSEA enrichment plots showing the comparison of gene expression profiles in high-grade tumors derived from N::TVA;Cdkn2alox/lox;Atrxlox/lox; Ptenlox/lox mice infected with viruses containing PDGFA, Cre, and IDH1R132H with the TCGA signature gene sets in neural, proneural, classical, and mesenchymal GBM as indicated. NES, normalized enrichment score; p value represents the statistical significance of the enrichment score; FDR, false discovery rate.

