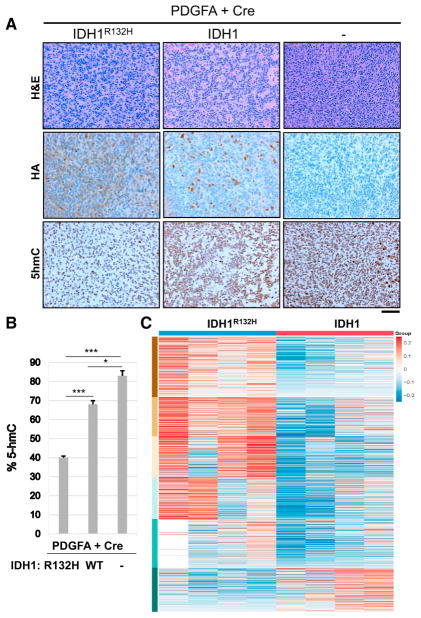
Figure 6. IDH1R132H Reduces 5hmC Levels and Alters the Methylation Landscape in Mouse Gliomas.
(A) Representative IHC images of 5hmC expression in gliomas generated in N::TVA;Cdkn2alox/lox;Atrxlox/lox;Ptenlox/lox mice injected with viruses containing PDGFA and Cre alone (right column) or in combination with IDH1R132H (left column) or WT IDH1 (middle column) as indicated. Scale bar represents 100 μm.
(B) Quantification of 5hmC IHC in all three tumor types.
(C) Heatmap comparing the relative difference of the regional fraction methylation of differentially methylated CpG regions between IDH1R132H and IDH1 samples.
Columns correspond to samples and rows correspond to regions organized into 6 groups by k-means algorithm. See also Figure S5.

