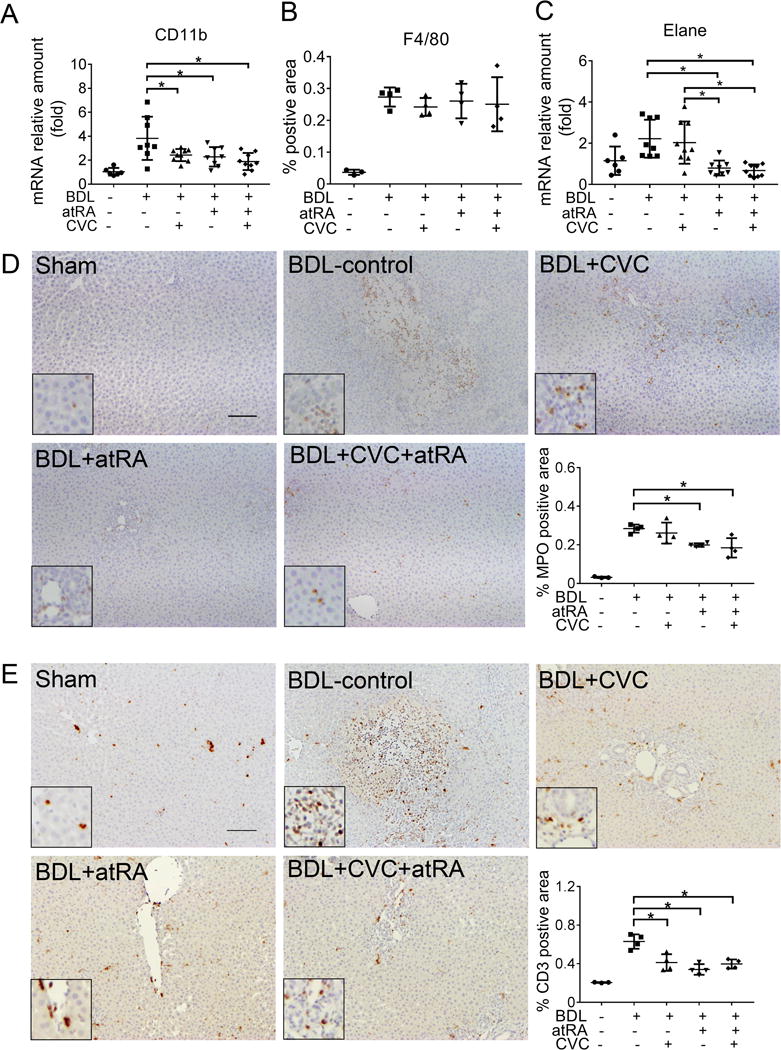
Figure 5.

The treatment of CVC or atRA alone or in combination significantly reduced neutrophil and T cell infiltration in the liver of BDL rats. (A) Liver mRNA expression of CD11b; (B) Quantitative analysis of immunohistochemical detection of liver macrophages using an antibody against F4/80; (C) Liver mRNA expression of Elane, a neutrophil specific elastase; (D) Representative image of immunohistochemical labeling of liver neutrophils using an antibody against myeloperoxidase (MPO) (brown, with a zoom-in area in the insert) and quantitative analysis of neutrophil positive areas in the liver section. (E) Representative image of immunohistochemical labeling of T cells using an anti-CD3 antibody (brown, with a zoom-in area in the insert). Of note, 3-4 representative animals from each group were assayed. For quantification, 10 pictures were randomly taken from each liver section for obtaining the raw data and the average of these 10 data points was presented here. The area of positive cells was measured using Image J software (version 1.46r, NIH). Scale bar = 100 μm. *p<0.05, n=3-4.
