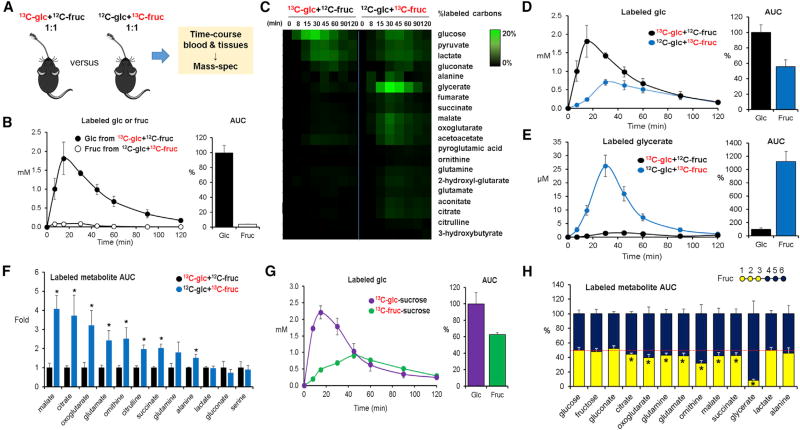
Figure 1. Isotope Tracing Reveals Differential Formation of Circulating Metabolites from Oral Glucose versus Fructose.
(A) Experimental scheme. Mice received an oral gavage of 1:1 glucose:fructose (one unlabeled and the other U-13C labeled, 0.5 g/kg each) and metabolite labeling was measured by LC-MS. Glc, glucose; Fruc, fructose.
(B) Oral fructose does not circulate primarily as fructose. Data show blood concentrations of the administered labeled hexose (either U-13C-glucose or U-13C-fructose, with the other administered in unlabeled form) and associated area under the curve (AUC0–120 min) for the labeled hexose normalized such that glucose AUC = 100% (N = 4).
(C) Oral fructose forms circulating glucose and organic acids. Heatmap shows the percentage of labeled carbon atoms in the indicated circulating metabolites from the administered U-13C-hexose (N = 4).
(D and E) Graphs show corresponding blood concentrations of labeled glucose (D) and glycerate (E) and associated normalized AUC0–120 min.
(F) Normalized labeled AUC0–120 min for other organic acids (N = 4).
(G) Mice received sucrose (1 g/kg) instead of the 1:1 mixture of glucose:fructose, with either the glucose or the fructose moiety of sucrose labeled (N = 3). The fructose moiety of oral sucrose forms circulating glucose.
(H) Mice received a 1:1 mixture of unlabeled glucose and partially labeled fructose (carbons 1, 2, 3 or 4, 5, 6 labeled). Circulating glycerate, and to a lesser extent several other organic acids, is preferentially formed from carbons 4, 5, 6 of fructose. Red line indicates equal labeling from carbons 1, 2, 3 versus 4, 5, 6 (N = 4 for 1, 2, 3 and N = 3 for 4, 5, 6).
Data are means and error bars are ±SE. *p < 0.05 by a two-tailed unpaired Student’s t test. Labeled concentrations refer to the sum of all labeled forms, in which each form is weighted by fraction carbon atoms labeled. AUCs are calculated by the trapezoidal rule. See also Figure S1.

