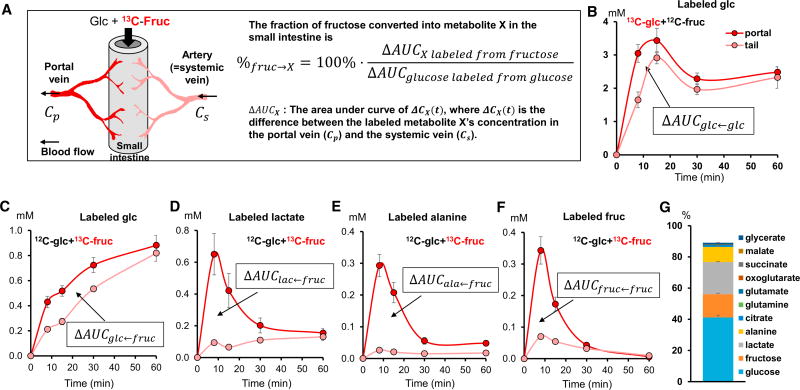
Figure 4. Quantitative Analysis of Intestinal Fructose Metabolism.
(A) Illustration of small intestine and associated circulation and mathematical equation for quantitation of intestinal fructose metabolism based on systemic-portal vein labeled metabolite concentration differences.
(B) Mice received a mixture of U-13C-glucose and unlabeled fructose and the concentration of labeled glucose in the portal vein and tail vein was measured (N = 3).
(C–F) Mice received a mixture of unlabeled glucose and U-13C-fructose and the concentration of labeled glucose (C), lactate (D), alanine (E), and fructose (F) in the portal vein and tail vein was measured (N = 4).
(G) Fate of fructose in the intestine. Stacked bars show the fraction of fructose arriving to the intestine that is converted into each of the indicated metabolic products.
Data are means and error bars are ±SE.

