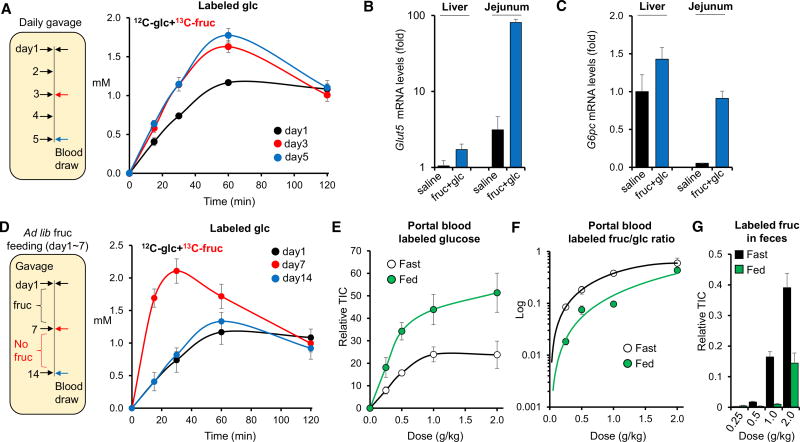
Figure 6. Intestinal Fructose Metabolism Is Enhanced by Previous Fructose Consumption and by Feeding.
(A) Mice received a 1:1 mixture of glucose and fructose (2 g/kg each) by daily gavage, with the fructose U-13C labeled on the measurement day. Data show systemic venous blood concentrations of labeled glucose derived from the oral labeled fructose (N = 5).
(B and C) Relative transcript levels of Glut5 (B) and G6pc (C) in liver and jejunum normalized such that liver from the saline-treated group = 1. Tissues were harvested 2 hr after oral gavage of saline or glucose + fructose (2 g/kg each) (N = 4).
(D) Mice received fructose in their drinking water (15% w/v) for 1 week, followed by gavage of a 1:1 mixture of unlabeled glucose and U-13C-labeled fructose (2 g/kg each) on day 7. Fructose was then removed from the drinking water for 1 week and the 2 g/kg gavage repeated. Data show systemic venous blood concentrations of labeled glucose derived from the oral labeled fructose (N = 5).
(E) Mice received increasing doses of a 1:1 mixture of unlabeled glucose and U-13C-fructose and the portal vein blood AUC0–30 min for labeled glucose was measured, after fasting for 6 hr or re-feeding for 2 hr (N = 3–5).
(F) Ratio of labeled oral fructose appearing in the portal vein as fructose versus glucose. Note that the y axis is in a log scale.
(G) Overflow of fructose into the feces. Feces were sampled 60 min after oral gavage (N = 4).
Data are means and error bars are ±SE. See also Figures S5 and S6.

