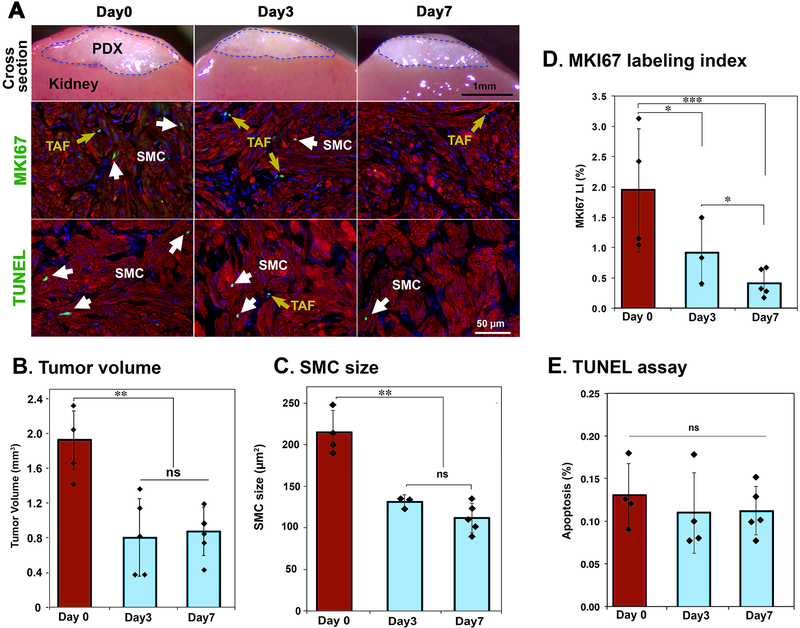
Figure 1. Cellular kinetics of LM PDX regression following hormone withdrawal – I: Short term response.
MED12-LM PDXs were grown for 4 weeks with E2+P4, and then the hormone pellet was removed (day 0). (A) Cross section of PDXs on the host kidney, MKI67 (green) and TUNEL (green) assays in PDXs at 0, 3 and 7 days after hormone withdrawal. SMCs are highlighted by ACTA2 (red) and nuclei are stained with Hochest (blue). (B) Volume of PDX. (C) Size (area) of SMCs by morphometric analysis. (D) MKI67 labeling index of SMCs. (E) Apoptotic rate by TUNEL assay. (E) Double staining images for TUNEL assay (green) and ACTA2 IF (red), apoptotic cells are indicated by arrows. The columns and error bars indicate average and SD, respectively. Each plot represents a measurement of a single PDX. The statistical significance by Tukey’s HSD Test was indicated as; ns, non-significant; * P < 0.1; ** P < 0.05; and *** P < 0.01.

