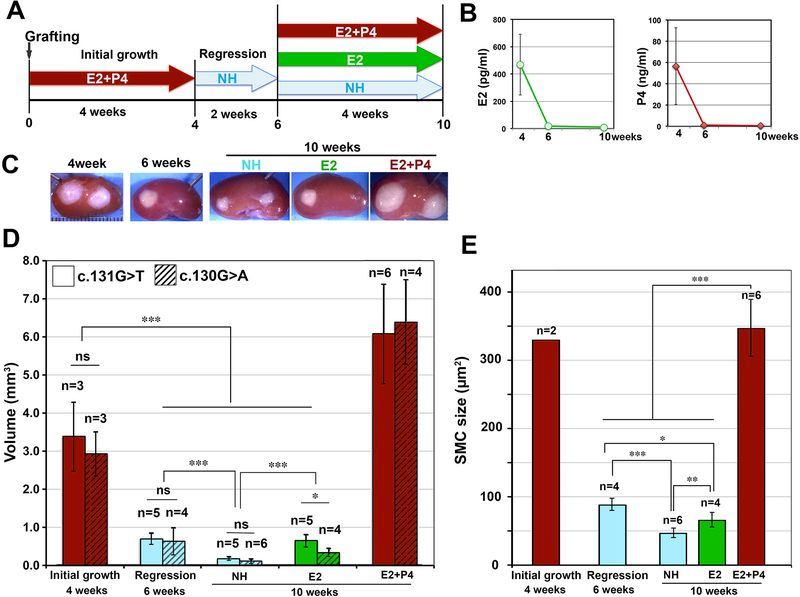
Figure 2. Cellular kinetics of LM PDX regression following hormone withdrawal – II: Long term response.
(A) Treatment schedule: PDXs were grown for 4 weeks with E2+P4, and then hormone pellets were removed. After 2 weeks of regression, host mice were supplemented with no hormone (NH), E2 or E2+P4 for 4 more weeks. (B) Average serum E2 and P4 levels. Error bars = SD (n = 5 – 12). (C) Gross appearance of PDXs on the host kidney. (D) Volume of PDX. The values of 2 independent studies are presented separately. (E) SMC size of PDXs from two independent studies. Equal number of PDXs from each experiment was included in the analysis. The columns and error bars indicate average and SD, respectively. The statistical significance by Tukey’s HSD Test was indicated as; ns, non-significant; * P < 0.1; ** P < 0.05; and *** P < 0.01.

